Nike Sales Data Dashboard Redesign
Every week, franchise store managers across the country opened a spreadsheet and tried to turn rows of numbers into a business decision. There was no visualization, no trend line, no signal — just data, waiting to be interpreted by whoever had the time and patience to dig.
As the product designer on this project, I set out to change that. This is a cloud-based desktop tool I helped build from the ground up — designed not just to display retail data, but to make that data speak. The goal was simple: give franchise store managers the clarity to act, not just the numbers to look at.
The System We Were Replacing
Before this tool existed, franchise stores were running on spreadsheets. Every quarter, store teams manually uploaded sales data to Excel or Google Sheets and sent it to headquarters for inventory planning. It worked — barely. Data got lost, errors crept in, and the people who needed insights most had the fewest tools to find them.
Rethinking This Step With AI
Back then, every upload was manual — spreadsheets, emails, and hope. If I were starting this today, I'd feed the raw upload logs and error reports into a language model first, to identify where data broke down most before any research began. The brief would be grounded in actual system behavior, not stakeholder assumptions.

We Started by Listening
The Historical Reports system wasn't designed in a vacuum. Before any wireframe was drawn, we needed to understand the real shape of the problem — not just the symptoms, but the underlying reasons why franchise stores were struggling with their data.
We conducted a thorough analysis of Nike's existing sales system and built a structured project plan around what we found: talk to the people, map what's broken, then design the fix.
What we set out to doDefinition
Understand the pain points driving the problem
Research
Build proto-personas from real user patterns
Solution
Sketch solutions for every problem found
Validation
Validate through lo-fi, wireframe, and hi-fi iterations
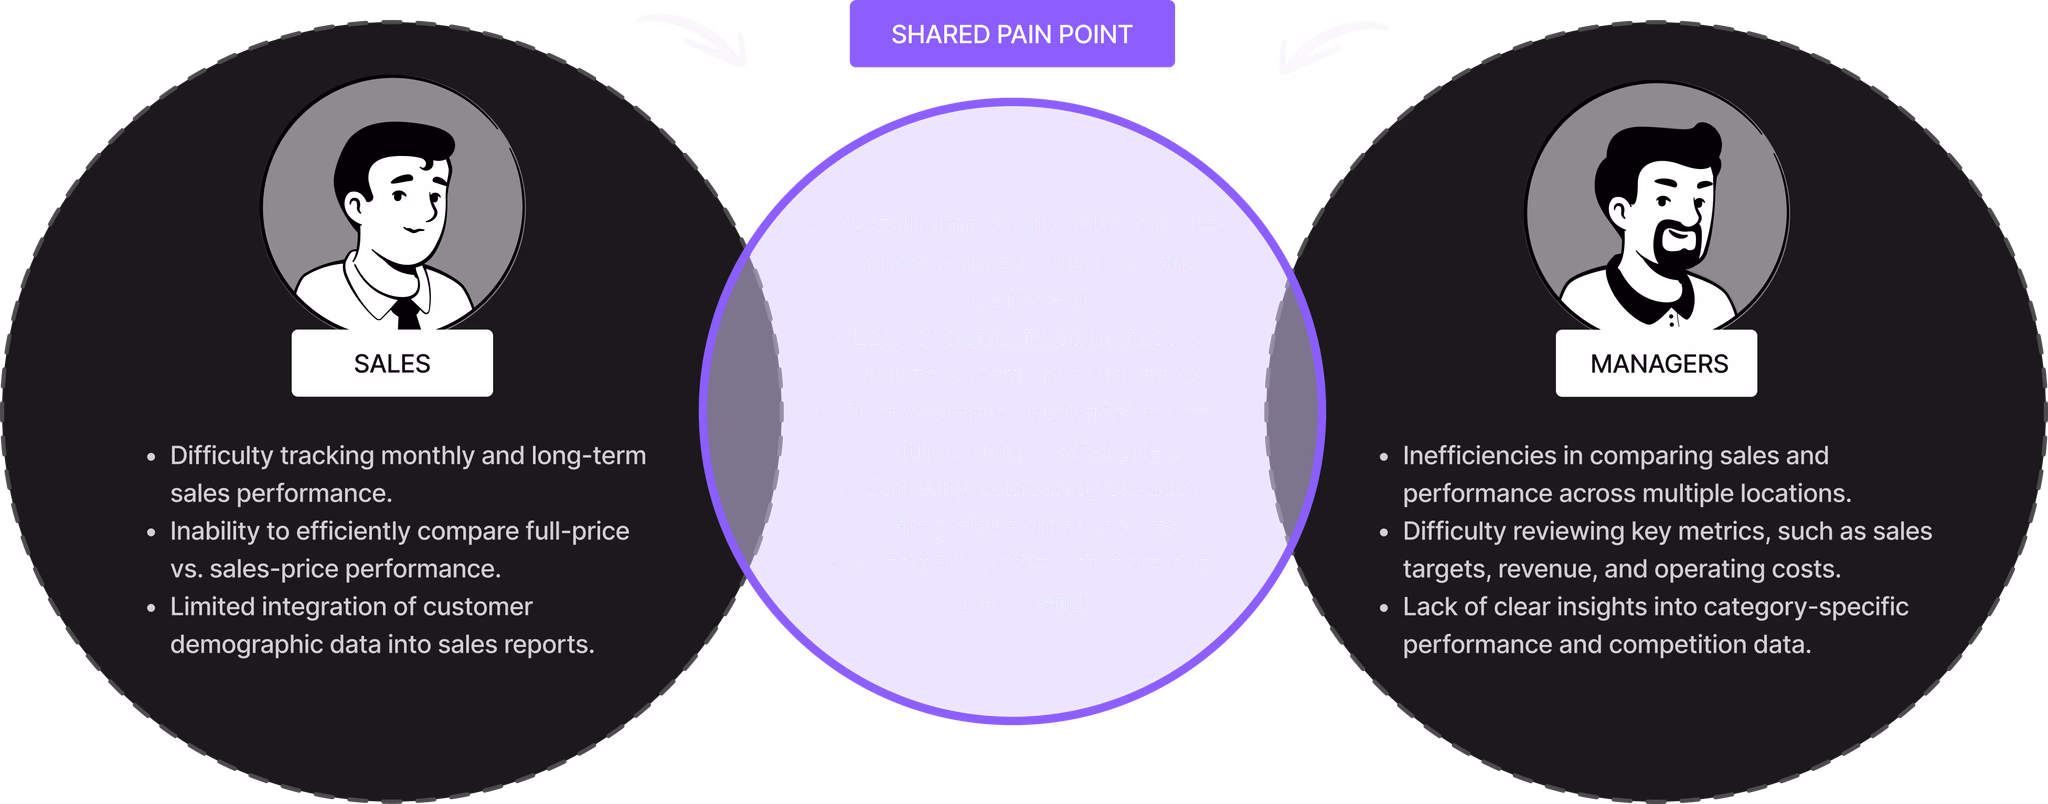
Two Users, One Broken System
The problems weren't random. They split cleanly into two groups — the people on the floor running the numbers, and the managers trying to make sense of them. Both were struggling, but for different reasons.
Rethinking This Step With AI
In 2015, synthesizing research meant a week of manual note review and whiteboard clustering. If I were doing this today, I'd use AI for the first pass — uploading transcripts to get an initial theme clustering, then spending my time interrogating those clusters rather than building them. The goal isn't to let AI do the research. It's to get to the "so what" faster.
The Person We Were Designing For
With the core pain points mapped, the next question was: who exactly were we designing for? The data pointed to one user type above all others — the store manager who needed answers, not analysis.

Stephen Carter
Nike Store Manager, Portland, OR, USAStephen isn't a data analyst. He's a store manager with four years of retail experience who happens to need data to do his job well. He manages daily operations, coordinates promotions, and tries to drive revenue — all while wrestling with a reporting system that was never built with someone like him in mind.
The system he uses gives him numbers, but not answers. He knows something is wrong with a product category, but he can't prove it. He wants to act confidently on data, but the data won't cooperate.
We built for Stephen.Behavior
Manages a Nike franchise store but struggles with large data volumes and frequent report inaccuracies.
Goals
Needs an efficient system to reduce analysis time and make data-driven decisions.
Challenges
Complex, uncustomizable system with inaccurate data that hinders trend analysis.
Opportunities
A visual, user-friendly system that helps him identify trends and act with confidence.
Rethinking This Step With AI
If I were doing this today, I'd use AI to generate a first draft of the persona framework — feeding in the interview transcripts and any available behavioral data to get an initial map of user types and their priorities. Then I'd use that draft as a structured provocation in a team workshop: here's what the data suggests, now let's argue with it. The personas that come out of that process are sharper, because they've been challenged rather than just assembled.
Finding the Gaps Between Touchpoints
To move from personas to design decisions, we needed to see the full picture — not just where users were frustrated, but where the system had fundamentally failed to bridge data and action. We mapped the journey across three phases, and what we found was less a journey and more a series of dead ends.
Identifying Touchpoints
Where did users open the system, what did they look for, where did they stop.
Analyzing Pain Points
Three failures kept surfacing: navigation that obscured, data that overwhelmed, no way to collaborate.
Defining Opportunities
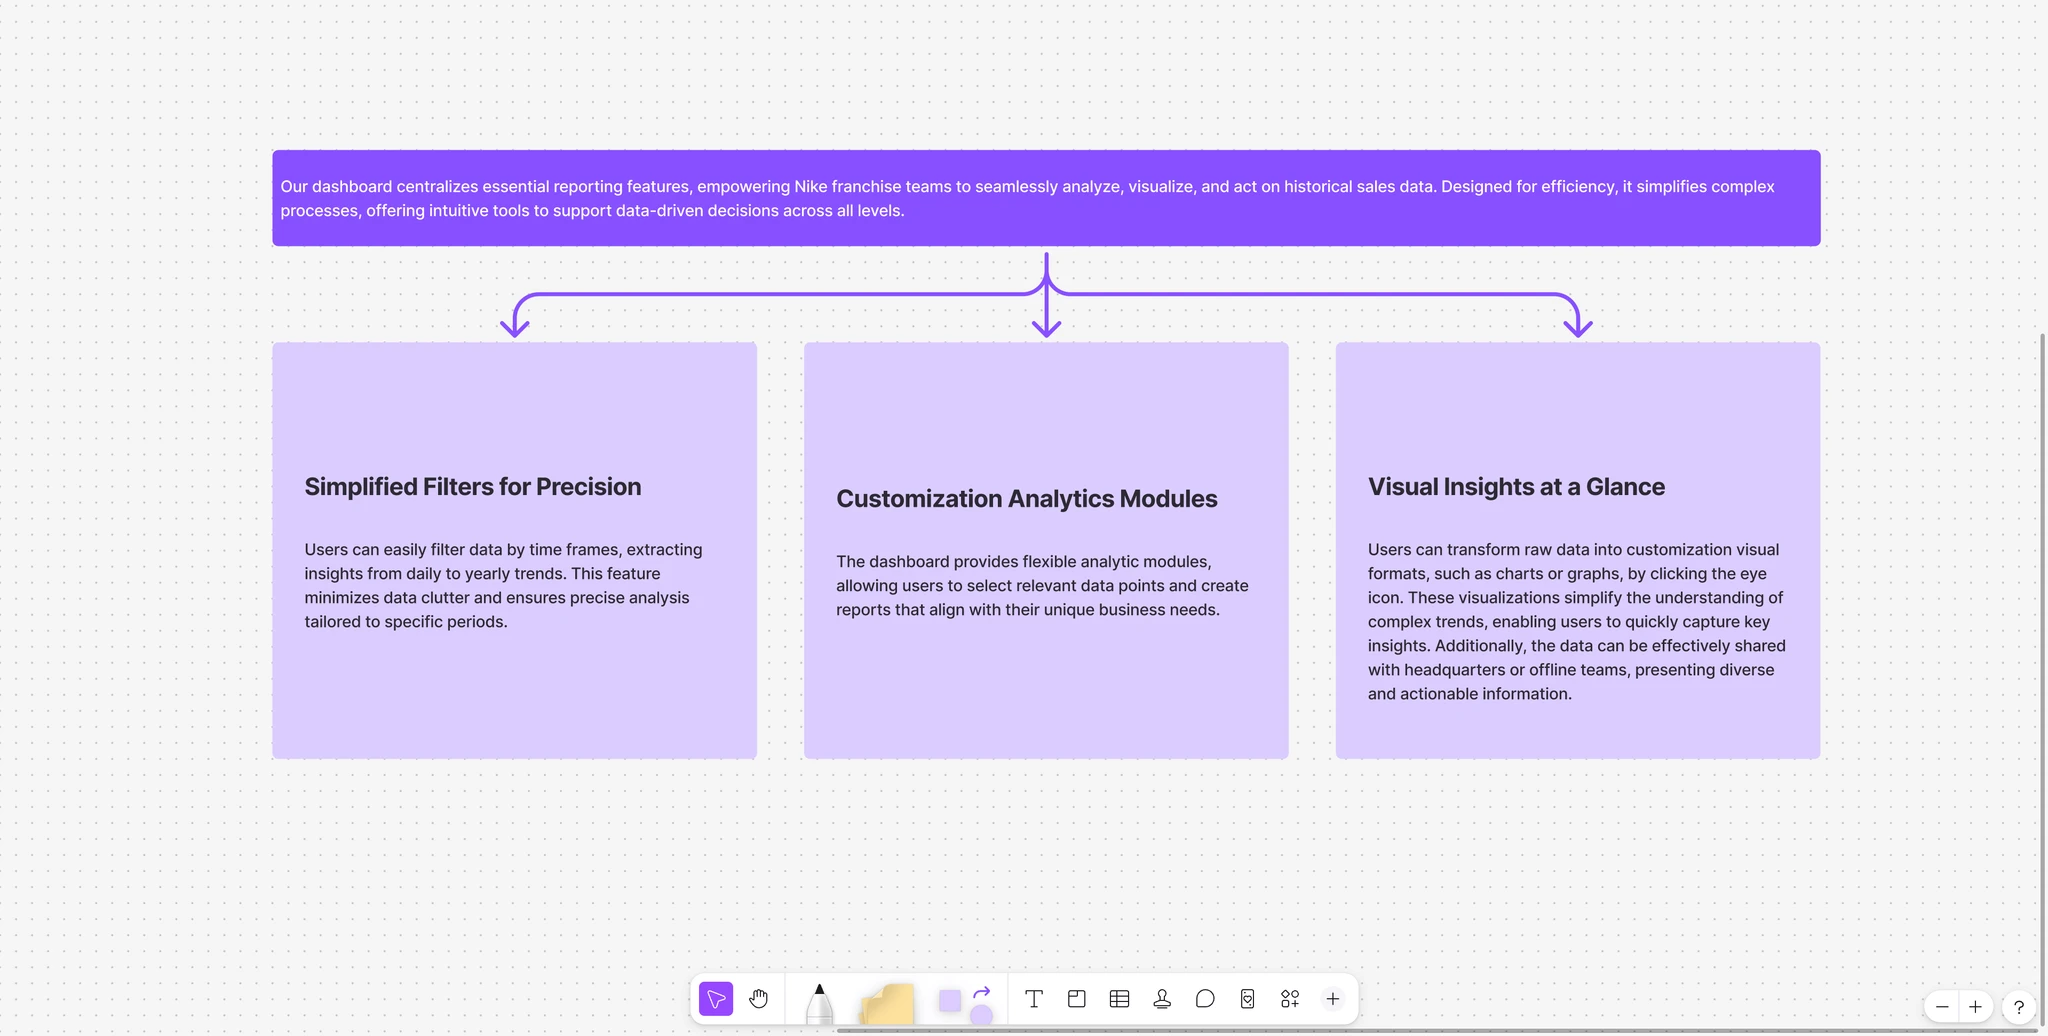
Unclear navigation → simplified filters. Data overload → customizable modules. No collaboration → unified dashboard.
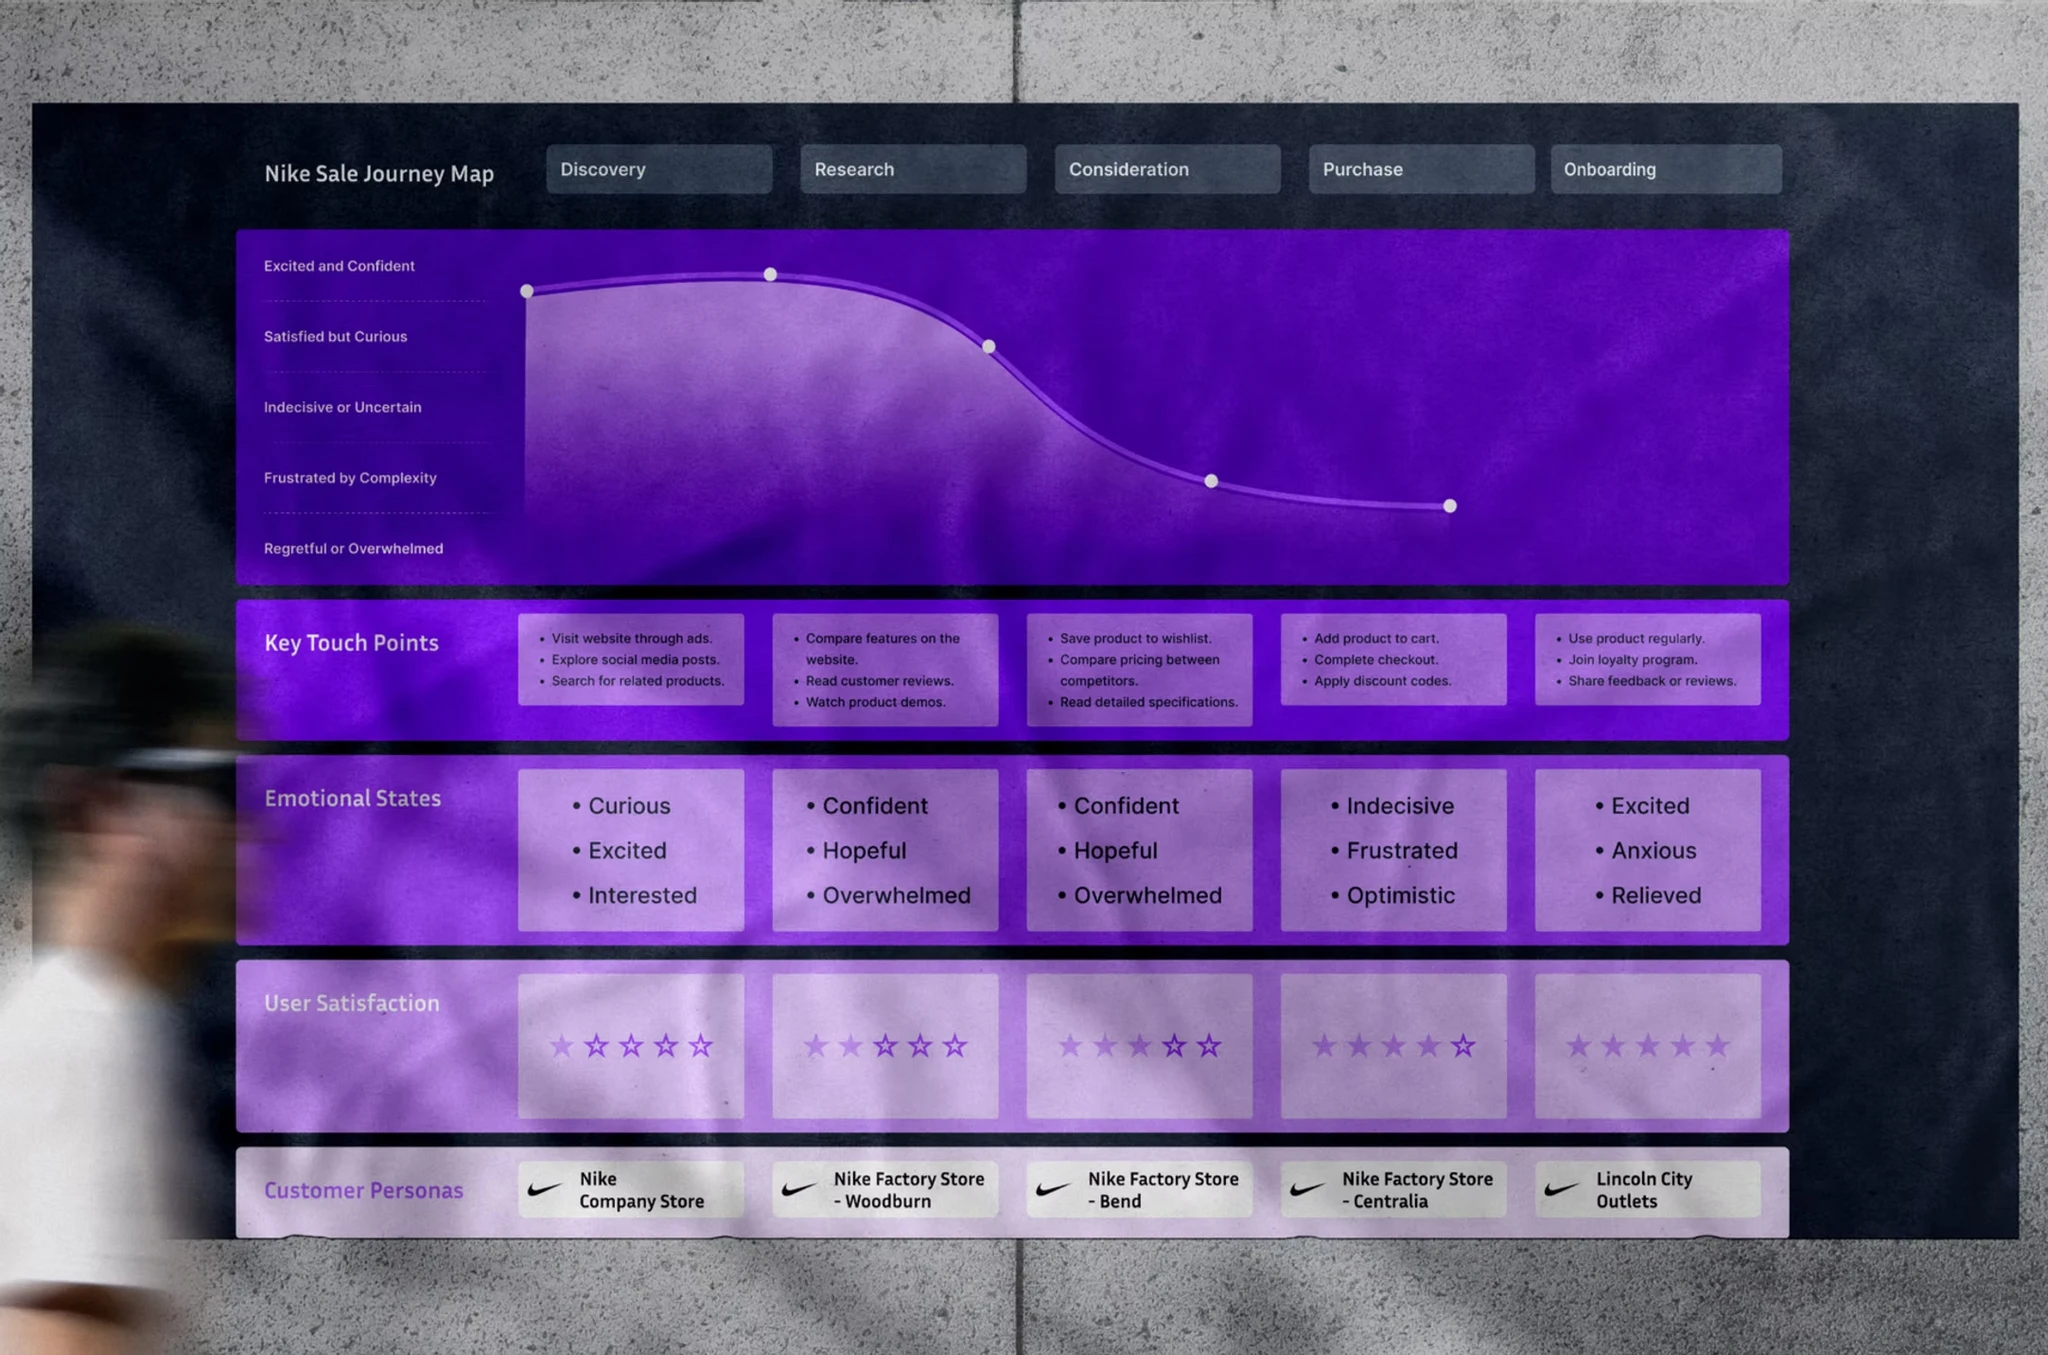
What the Journey Map Revealed
The journey map gave us more than touch points — it gave us the moments where the system quietly failed. Four patterns kept surfacing: navigation users had to memorize, tasks that always spanned two systems, a tool that never adapted to the person using it, and data that invited guessing instead of reading.
The fix wasn't one big redesign. Each failure pointed directly to a solution: streamlined filters, customizable modules, a unified dashboard, intuitive visualizations.
Three Principles We Would Not Compromise On
Before the first wireframe, we wrote down what this system had to be. Not features — principles.
User Efficiency & Clarity
Every extra click is a tax on attention. We cut unnecessary steps and made the most common tasks require the fewest actions.
Data-Driven Decision Support
Showing data is easy. Making it actionable is hard. One question drove every decision: does this help the user decide what to do next?
Engagement & Scalability
A tool that only fits today is a temporary fix. We built for the stores Nike has now and the ones it will have in five years.
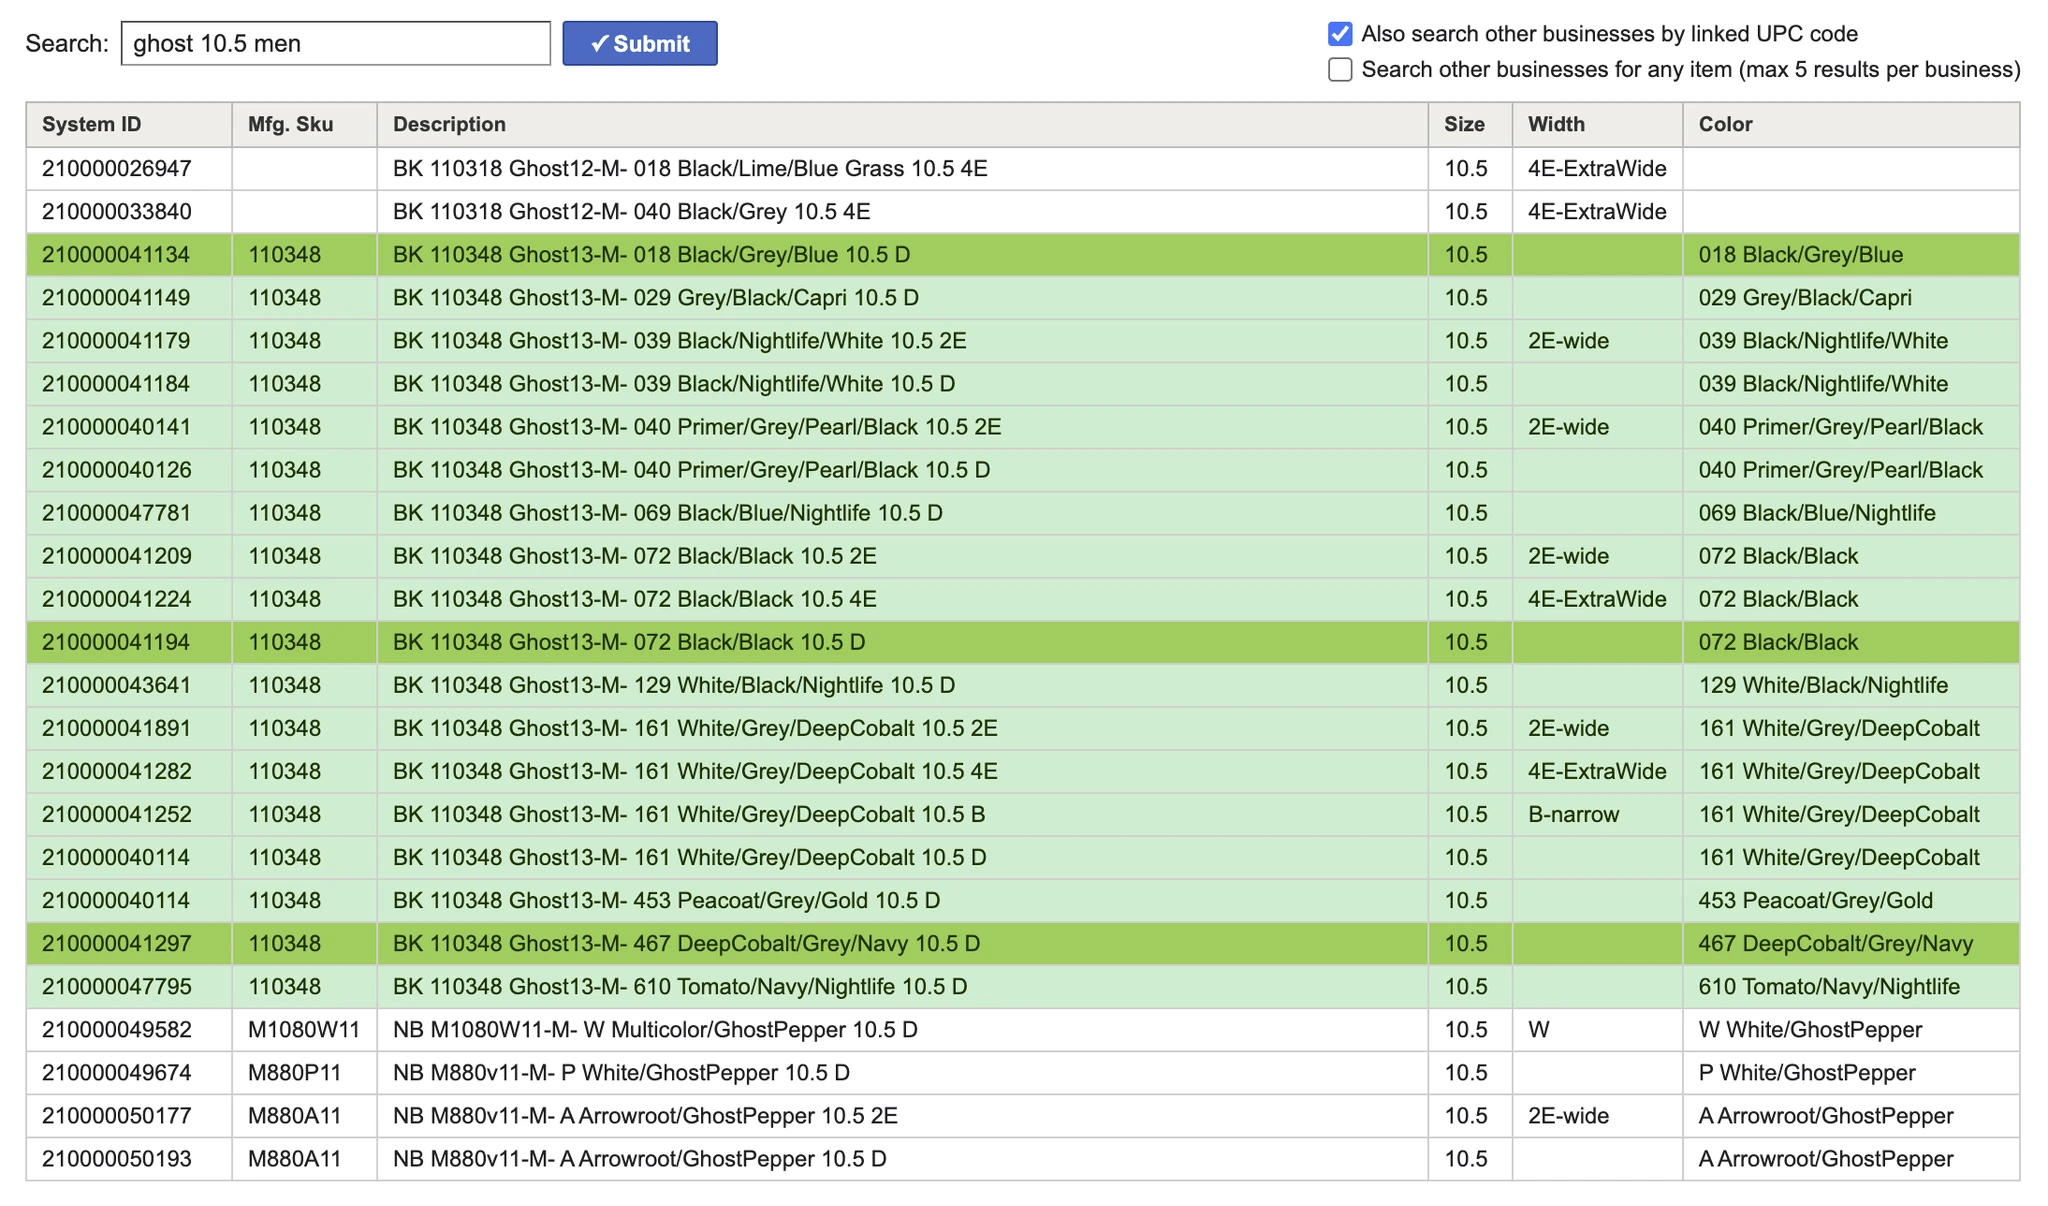
The Problem With Their Current Tool
We didn't just interview users — we used the old system ourselves. What we found confirmed everything they'd told us, and then some.
The existing workflow was built around manual uploads to Excel and Google Sheets. Every data point was touched by a human hand — which meant every data point was a potential error, a potential inconsistency, a potential delay.
Error-Prone Processes
Errors were inevitable. With no reconciliation layer, they compounded silently — only surfacing after a bad decision had already been made.
Lack of Customization
The tool offered one view for everyone. But a Portland store manager and a New York regional director need completely different things from the same dataset.
Poor Data Visualization
Walls of text and raw tables don't communicate trend direction — they communicate volume. Users weren't reading the data, they were surviving it.
Designing the Flow Before Designing the Screens
We tested several flow architectures before committing to one. The question wasn't "how do we organize the features?" — it was "what does Stephen need to happen in the first thirty seconds?"
The answer: he needs to know immediately whether things are going well or not. Everything else is a detail he can choose to explore.
The final flow starts at the dashboard — an overview of sales trends and key metrics that gives Stephen his bearings in seconds. From there, he can drill into historical data, run comparisons, and generate custom reports. Each step forward is a choice he makes with context, not a guess in the dark.
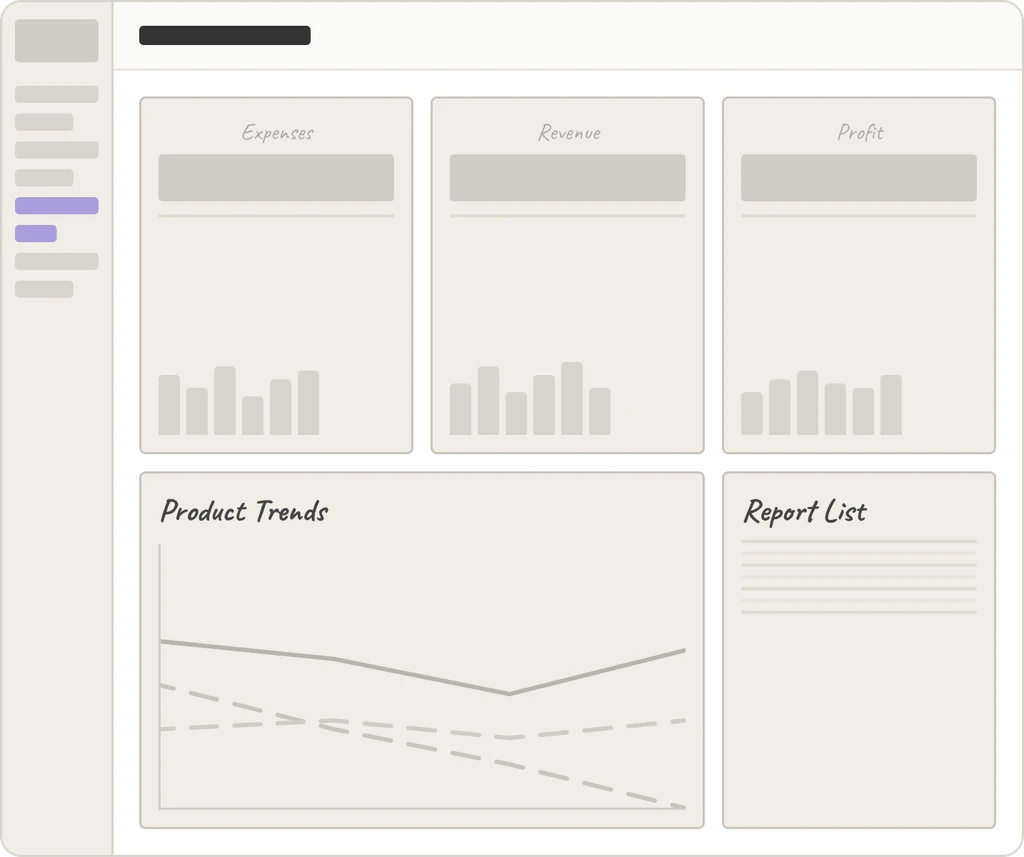
Option A: All-in-one flat layout
Pros & ConsAll data is visible at once, making cross-section comparison easy — but heavy compression leaves each module too small to read effectively, with no clear visual hierarchy to guide the user's eye.
Discarded. When every module loses depth, none of them support a real decision.
Option B: Focus-first, expand on demand
Pros & ConsKeeping KPIs front and center reduces cognitive load on first view — but collapsed sections force daily users to re-expand every visit, and prevent cross-module comparison, creating friction at scale.
Discarded. Collapsed layouts suit infrequent tasks. Forcing the same user to expand the same sections every day is a design failure.
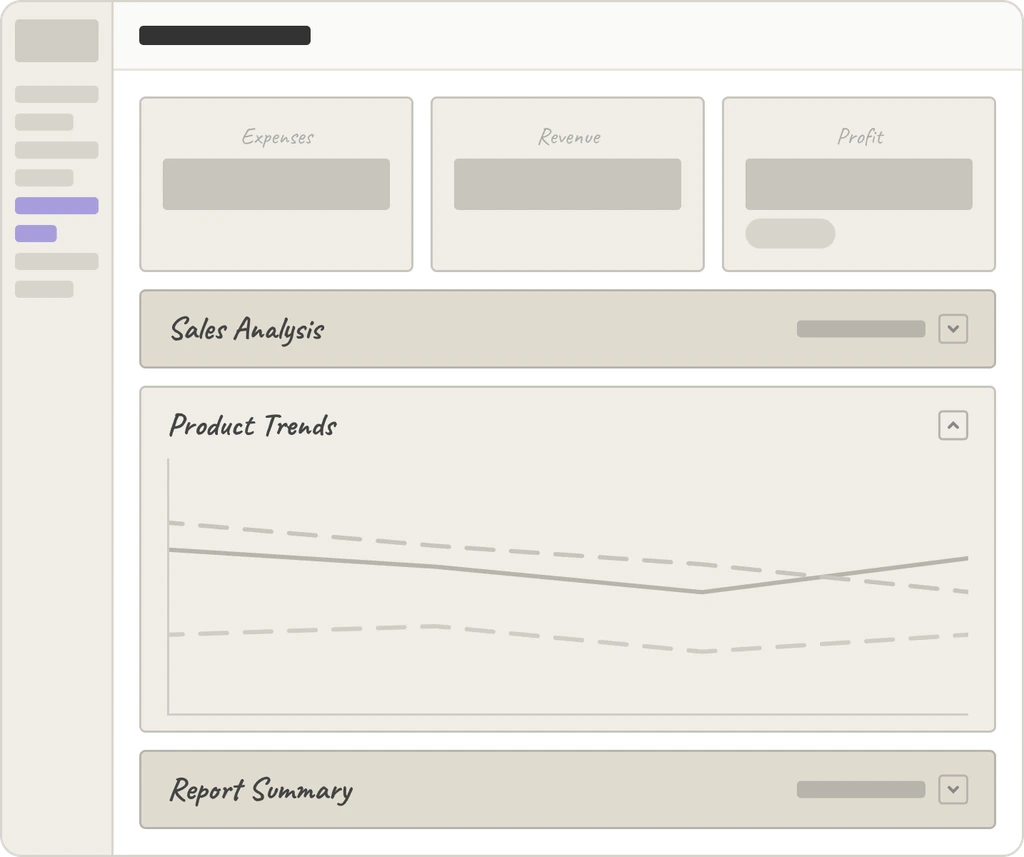
Option C: Timeline + Master-Detail
Pros & ConsThe top-down flow and Master-Detail layout keep every key view accessible without navigation, delivering the shortest daily task path — though the vertical layout requires scrolling and the detail panel can feel tight on smaller screens.
Selected. Matches how a manager actually thinks — big picture, then trends, then a specific date. Everything happens on one screen.
The Sales Manager's core use case is high-frequency daily review, not occasional browsing. Option A's flat layout sacrificed readability across every module — too much data density, too little insight. Option B's collapsed design looked clean, but forced daily users to manually expand sections on every visit, creating repetitive friction at scale.
Rethinking This Step With AI
Wireframing in 2015 meant sketching on paper first, then rebuilding everything in a digital tool — two separate steps that each consumed time. If I were doing this today, I'd use AI to generate a set of rough layout variations from the feature list before I started sketching. Not to replace the sketching process, but to give myself something to react against. I find I make sharper design decisions when I'm critiquing options rather than generating from nothing — and AI-generated wireframes are a good enough starting point for that kind of structured critique, even when the outputs themselves aren't what I'd ship.
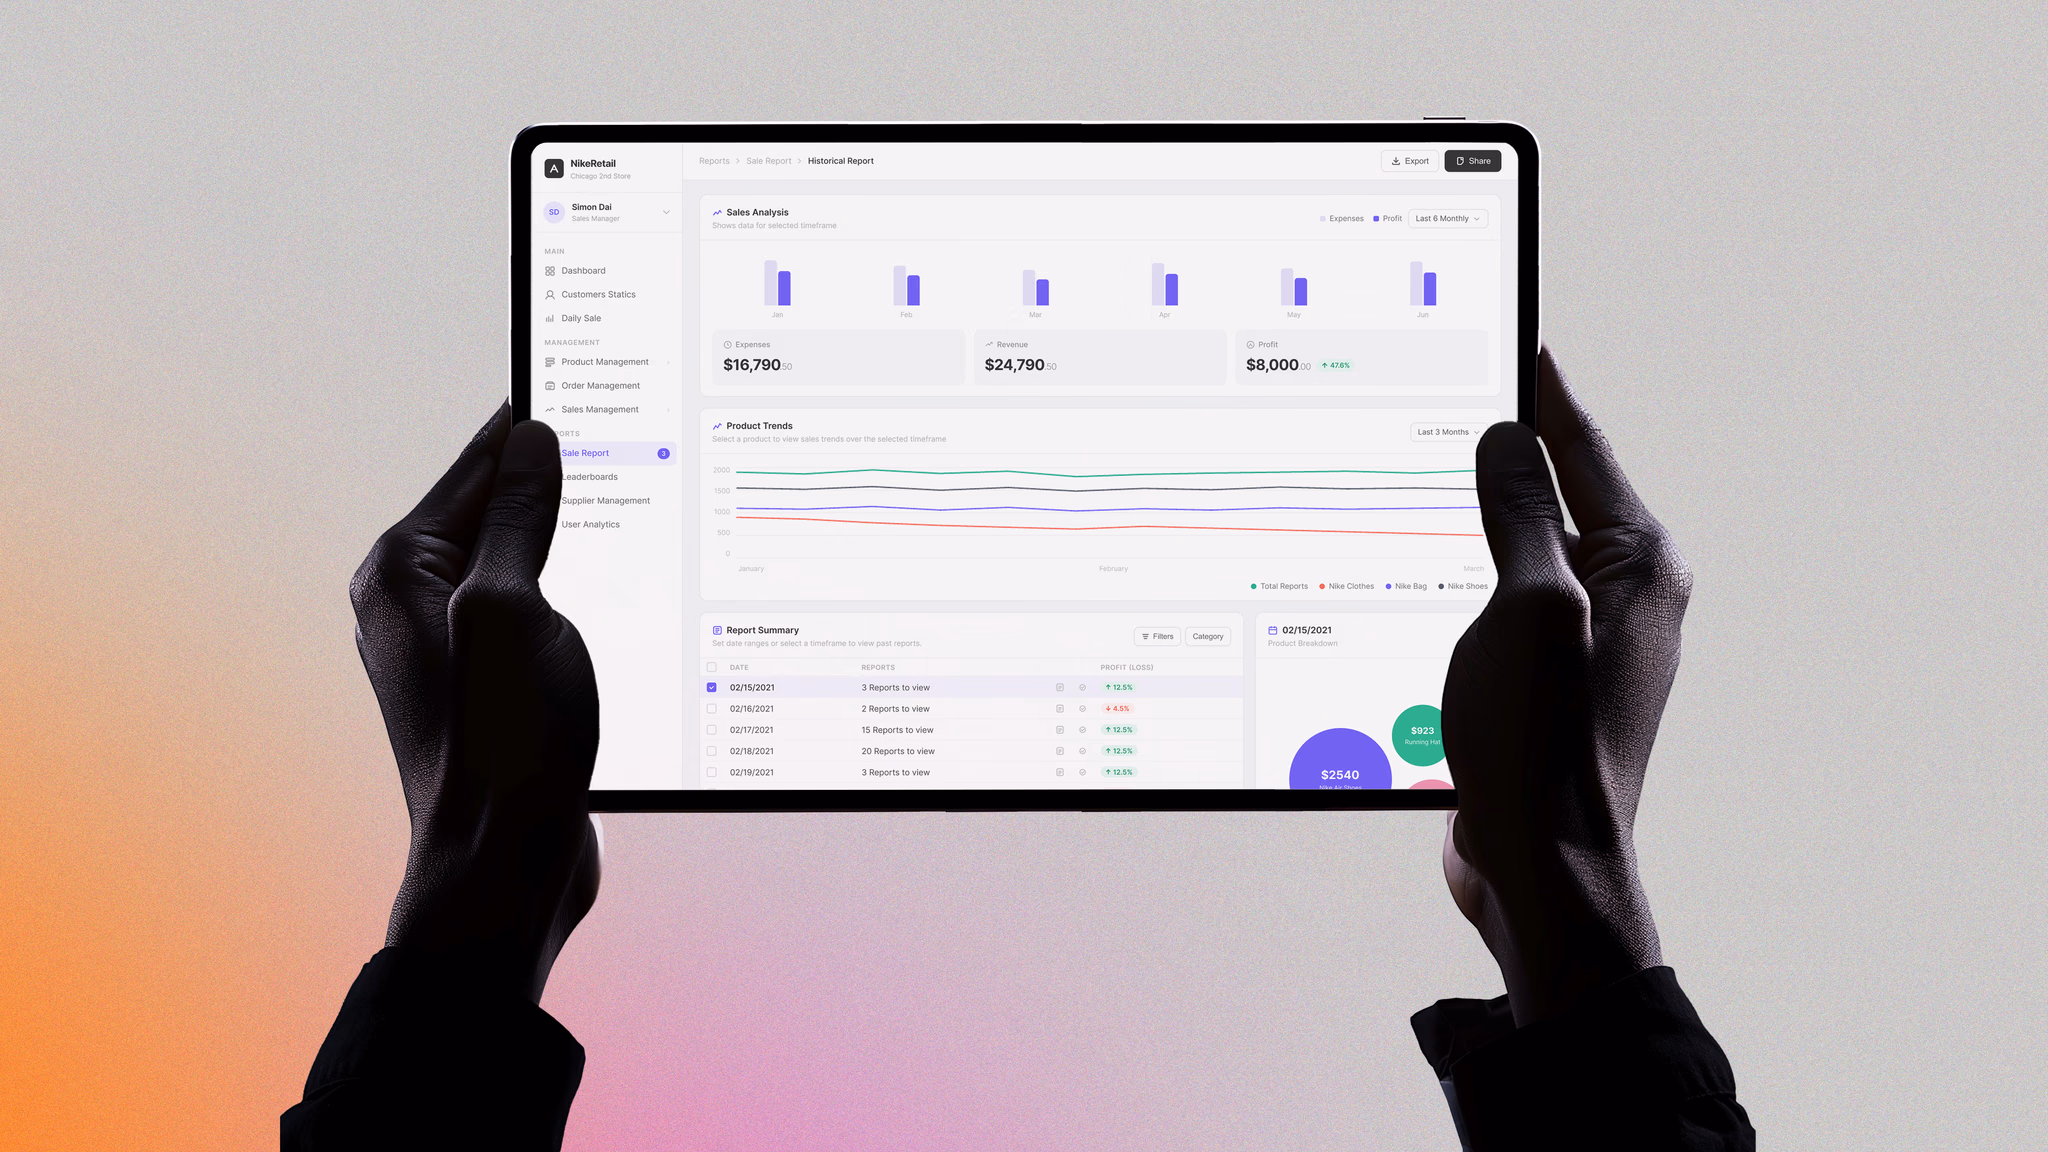
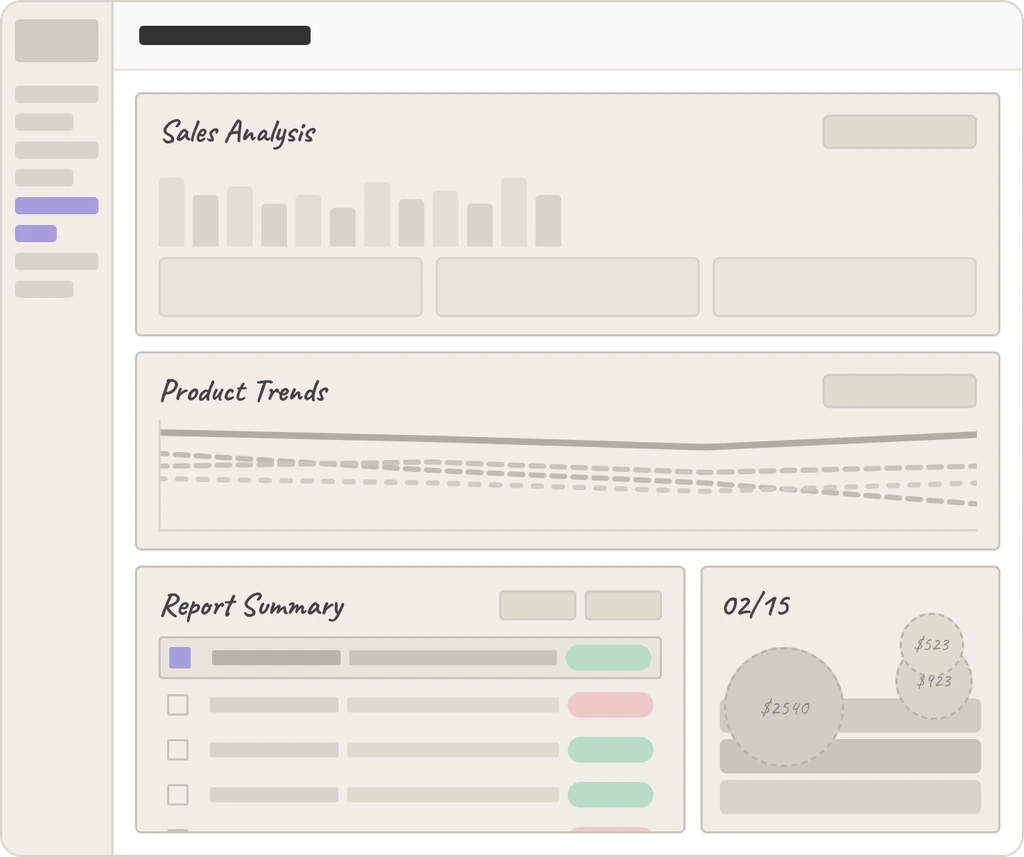
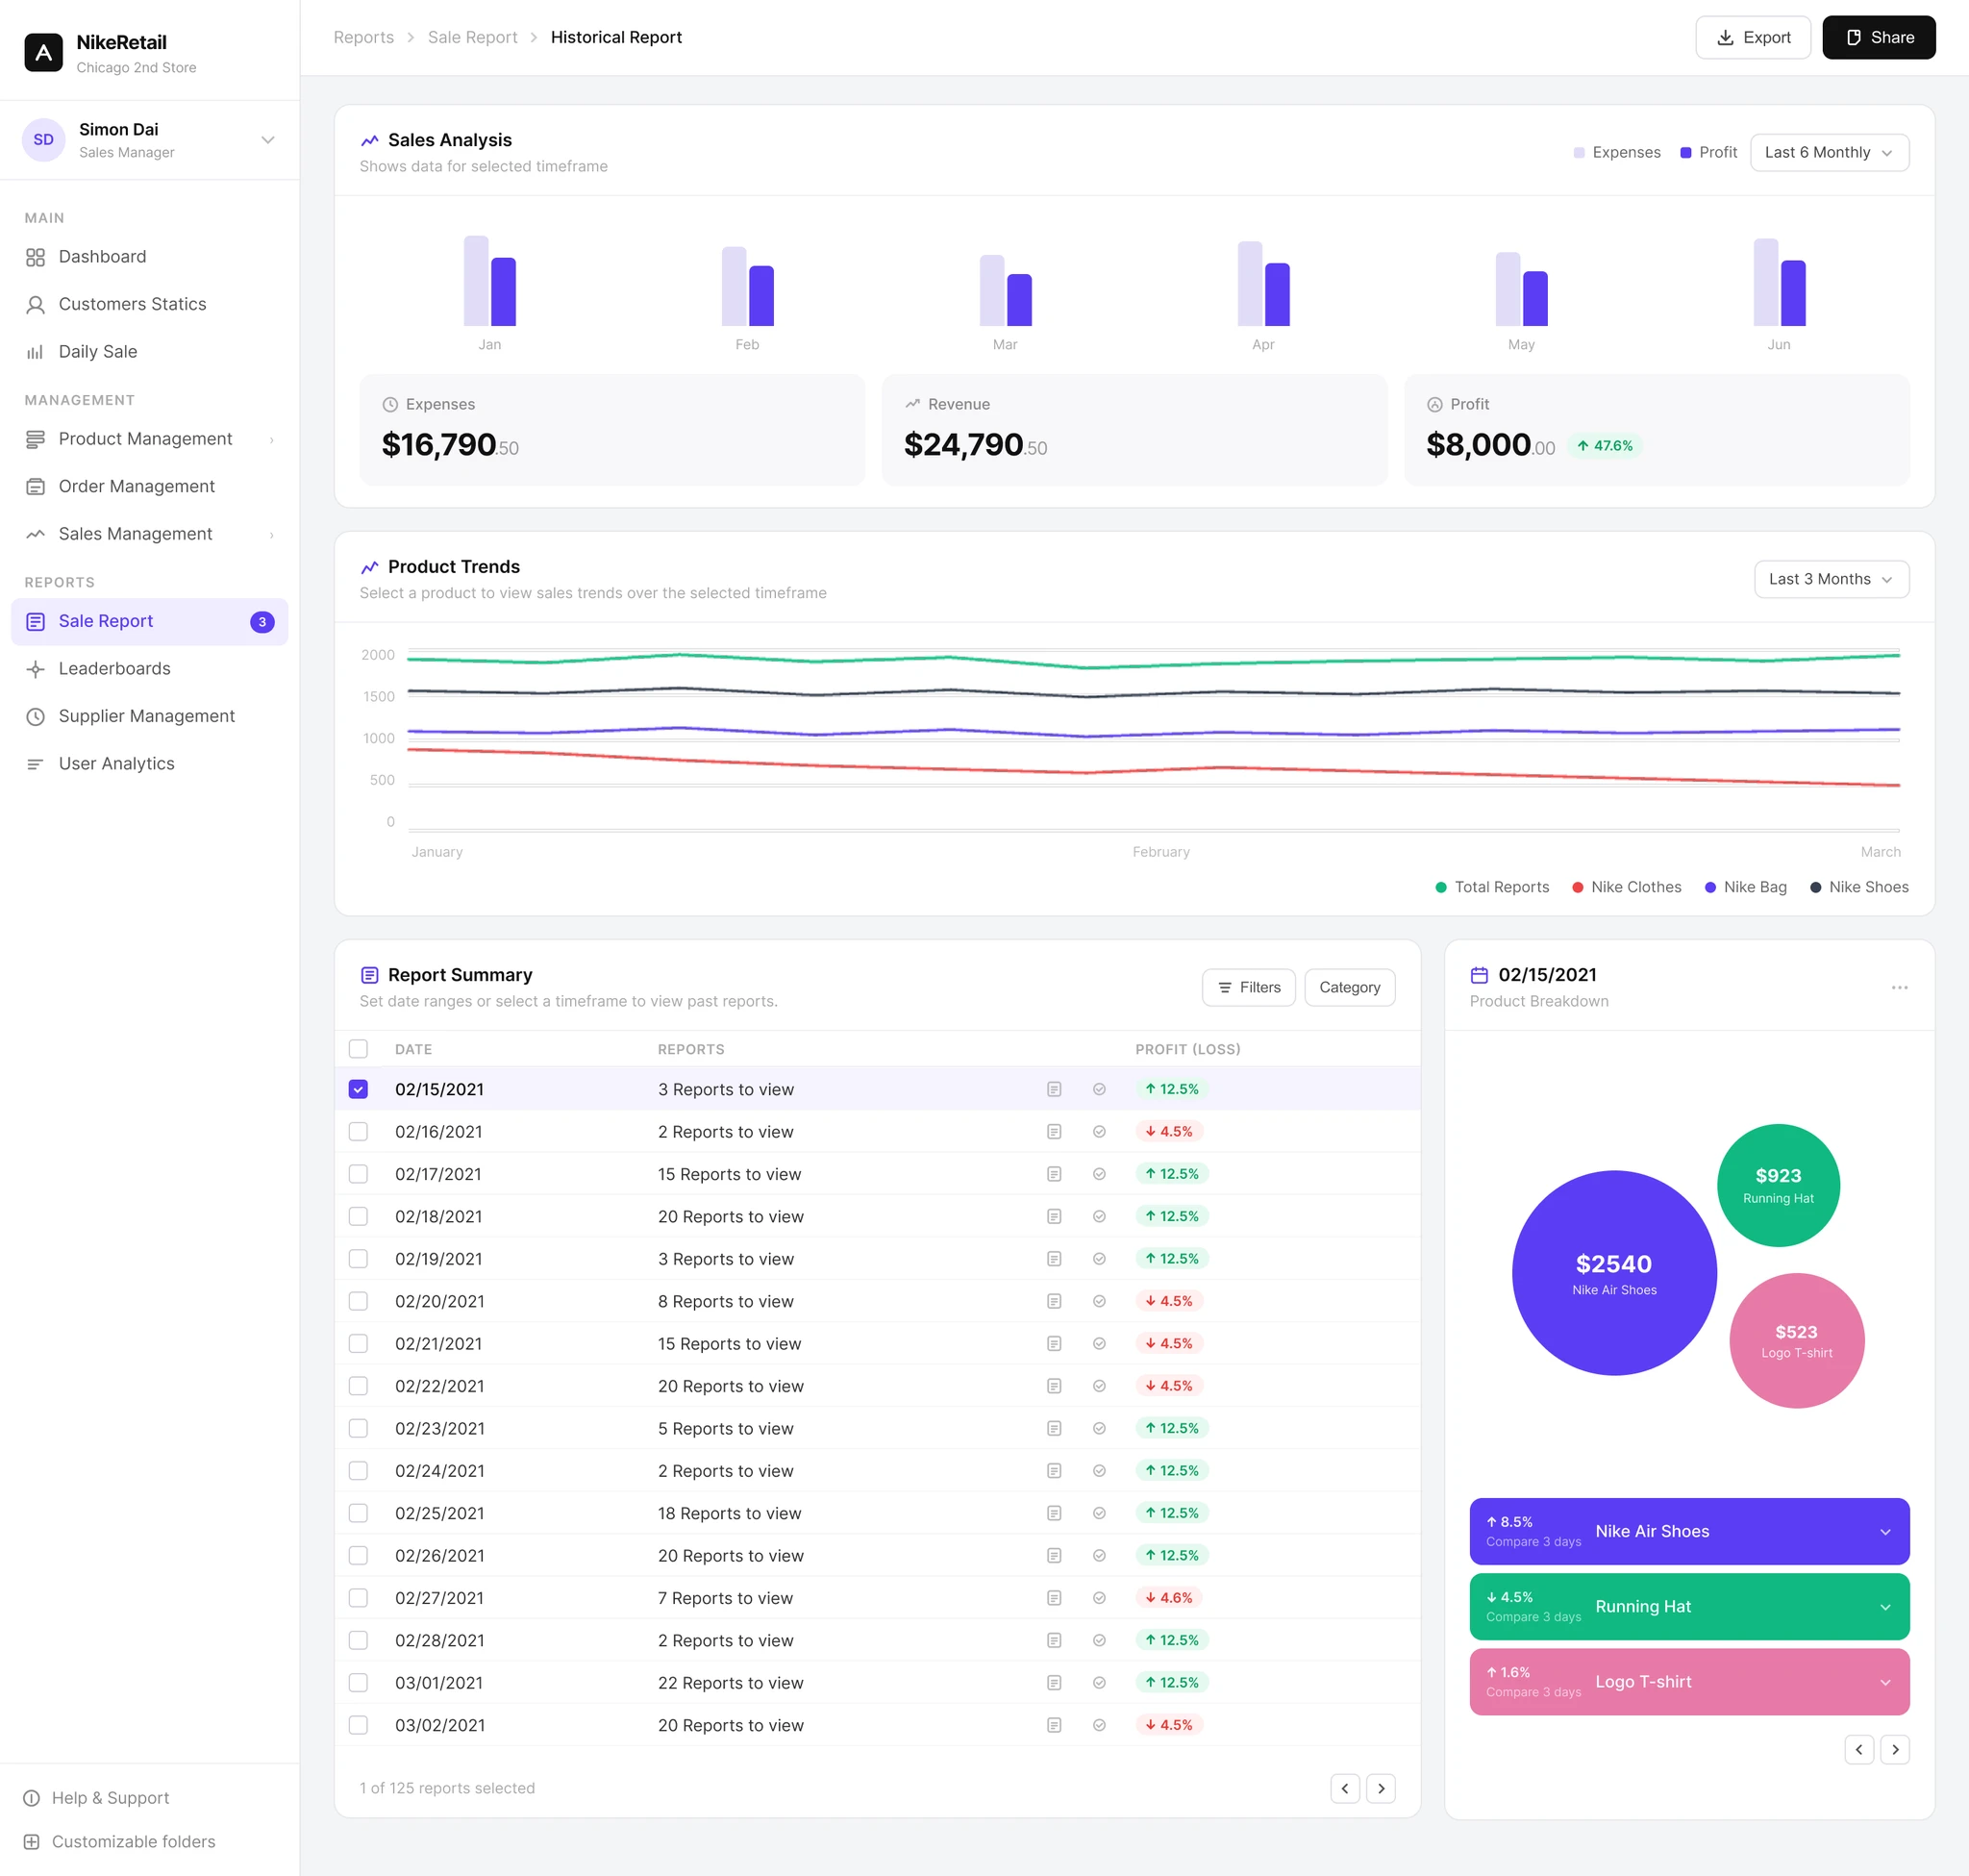
What It Looked Like When It Was Real
This is the design I built. Due to copyright constraints I can't show Nike's final integrated version — but the data visualization layer at the heart of their final product was adopted directly from this concept.
What you're looking at: a store manager opens one screen and immediately sees expenses, revenue, and profit for the last six months — with trend lines showing each product category's trajectory. Below, a report summary gives line-by-line detail. In the corner, a bubble chart shows relative category performance at a glance.
Every design decision on this screen traces back to something a user told us they needed. That's not a coincidence — it's the process working.
The Numbers That Proved It Worked
We didn't ship and hope. We tested — and the results were clear enough to present directly to Nike headquarters.
The core message was clear: this tool delivers actionable insights and measurable value across retail operations.
What I learned
Being the sole designer on an 8-person team taught me something I couldn't have learned any other way: when there's no one else to hand the problem to, you get very good at deciding what matters. I learned to defend design decisions with evidence, not instinct — because instinct alone doesn't survive a product review. I learned that the most important conversation in any B2B project isn't about the interface. It's about what the user needs to believe before they'll trust the tool enough to change how they work.
What I'd do differently
The Interactive Directions module was the right idea, but we shipped it without a feedback layer. Users could read the recommendations but couldn't push back on them — couldn't say "this doesn't apply to my store right now" and have that signal mean anything to the system. That's the piece I'd build first if I did this again. Not because it's technically complex, but because a recommendation system without disagreement handling isn't actually intelligent — it's just assertive. The best version of this tool would learn from the moments users ignored it, not just the moments they followed it.
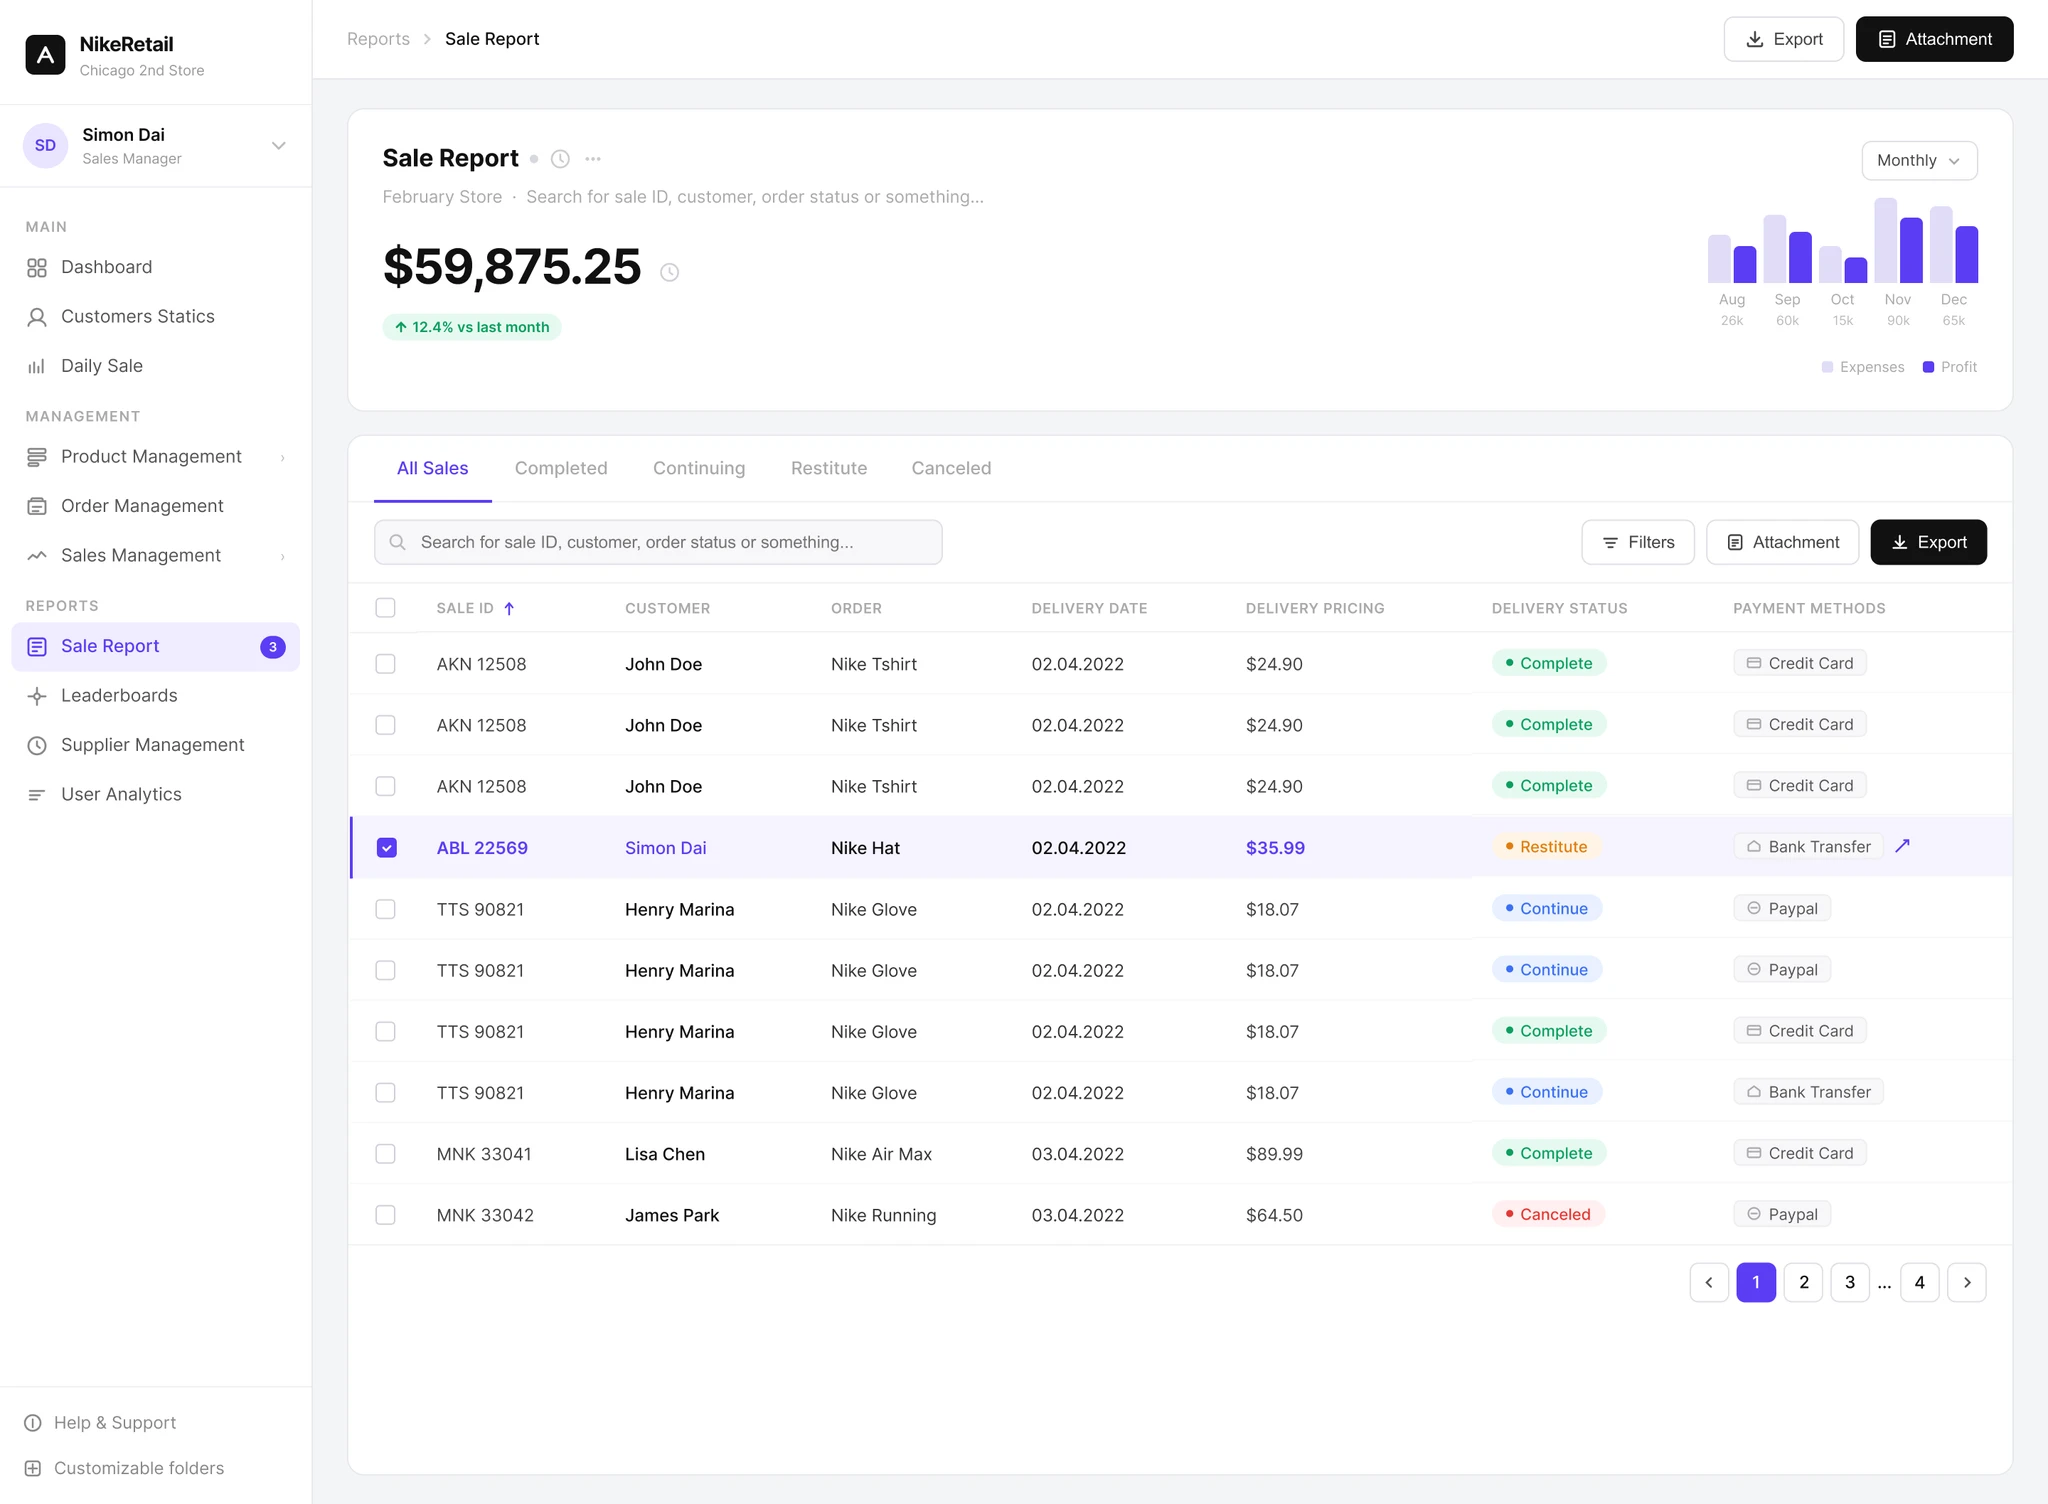
Built It to Prove It
This isn't a Figma mockup — it's a working prototype built with Claude Code and Cursor. You can navigate the dashboard, filter by timeframe, and switch between chart and raw data views. Building this was part of how I validated the design decisions described above.